
Category - Terrain Mapping,Altitude,Stitching
Posted - 05/26/2017 02:46pm “The Nunns Effect†some notes on the effect of altitude and terrain on map stitching
The advise we received was to fly as high as possible (up to 350 ft from the top of the trees) and to increase our stitch. So we set our altitude at 400ft (max allowed) and increased our stitch to 70/85%. This was the best map we could come up.
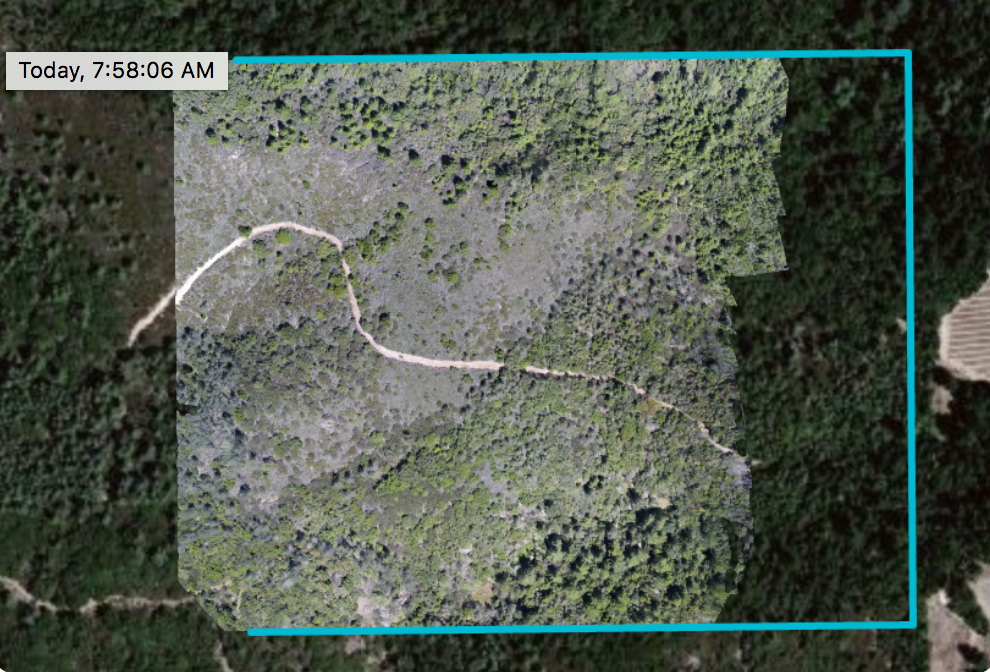
The right side of the map was a total failure! After 2 tries. We filled that area in with imagery from a photo panorama app, the Customer was happy and all was good. But how to fix it was now the burning question.
So the right margin of the map shows a complete stitch failure, no beuno. Upon closer examination, I also noticed, near the failure these images.
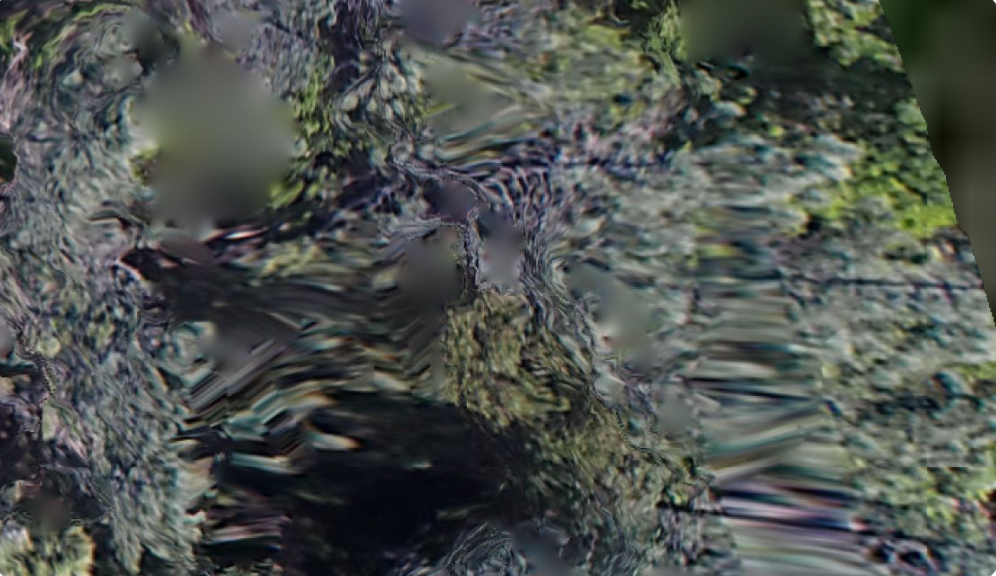
These weren’t tree tops, they were weird, they were ‘swirly gigs’. Something produced by the stitch engine or perhaps by gremlins (historical aeronautical reference). Searching the imagery back from the failure, downhill, I noticed other imagery like this;
Better imaging for sure, but still with some swirliness to it. Still a stitching error. Going back to our launch point the imagery looked like this. And farther down the hill to our launch point we got actual trees takes from an altitude of 400 feet. And no swirly gigs.
OK, so that provided the first hint. Stitch errors and finally stitch failure seem to have something to do with altitude, or the drone AGL. Another insight about the stitching process, was that the map was not just just a bunch of snippets from the images stitched together as if it were a patchwork quilt. It was something else.
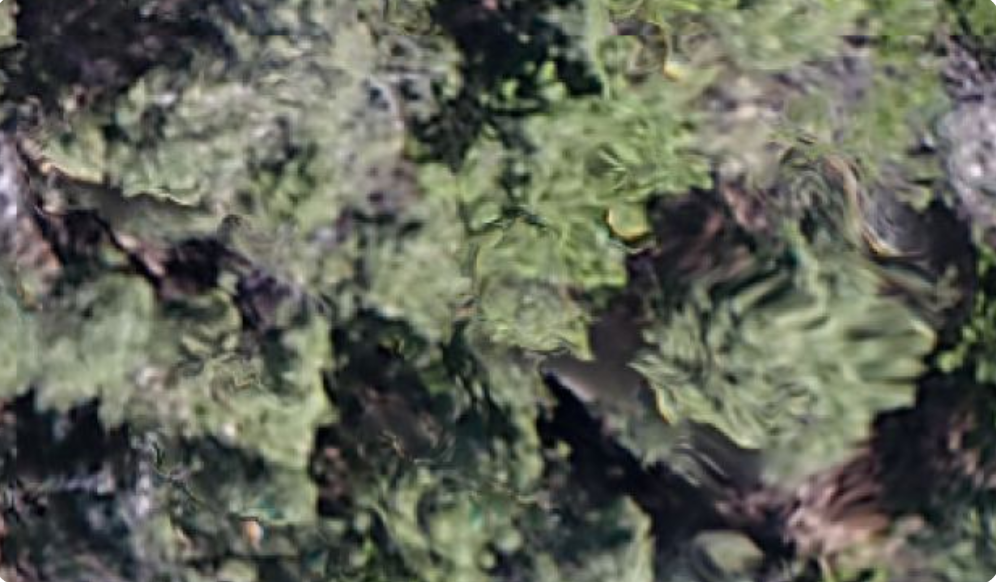
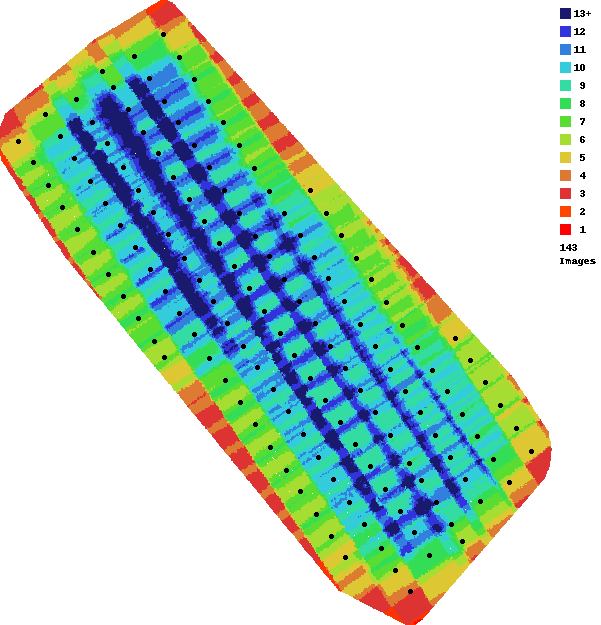
So onto other projects, this time a really cool project where we are recording the growth of a vineyard with biweekly missions. Here tall trees are not the issue, but hilly terrain is still something to deal with. So all is good and we’re getting great maps showing vine growth and suddenly on a flight we get this.
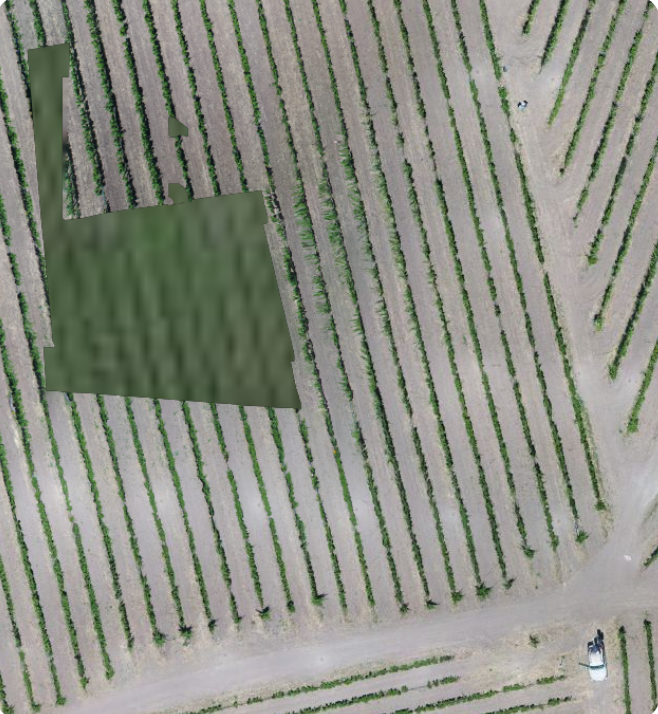
Same kinda thing we saw in the other job, quien sabe?? Same type failure n errors. So I zoomed way way into the map, and here is what I saw. At the launch point;
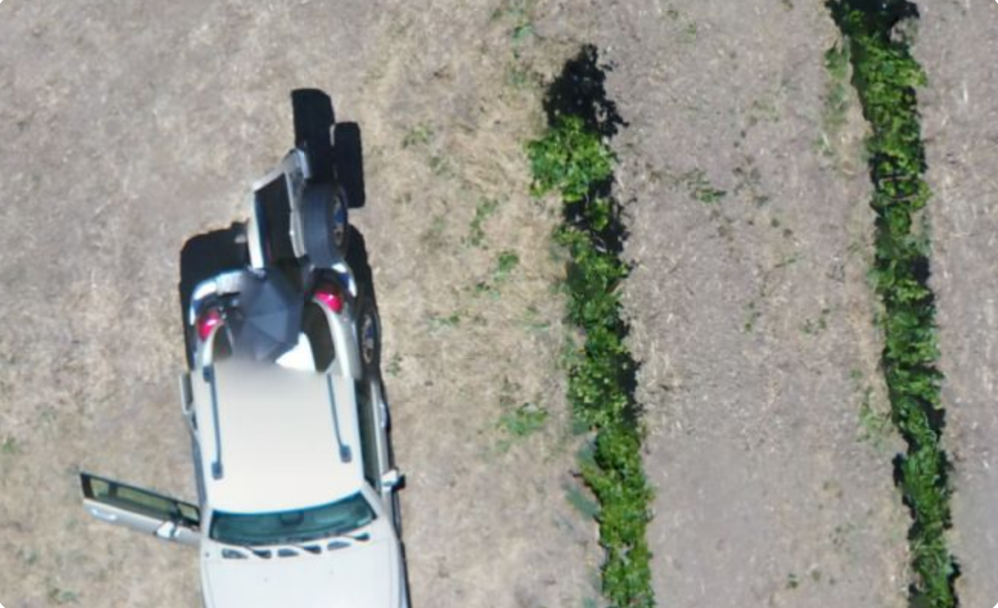
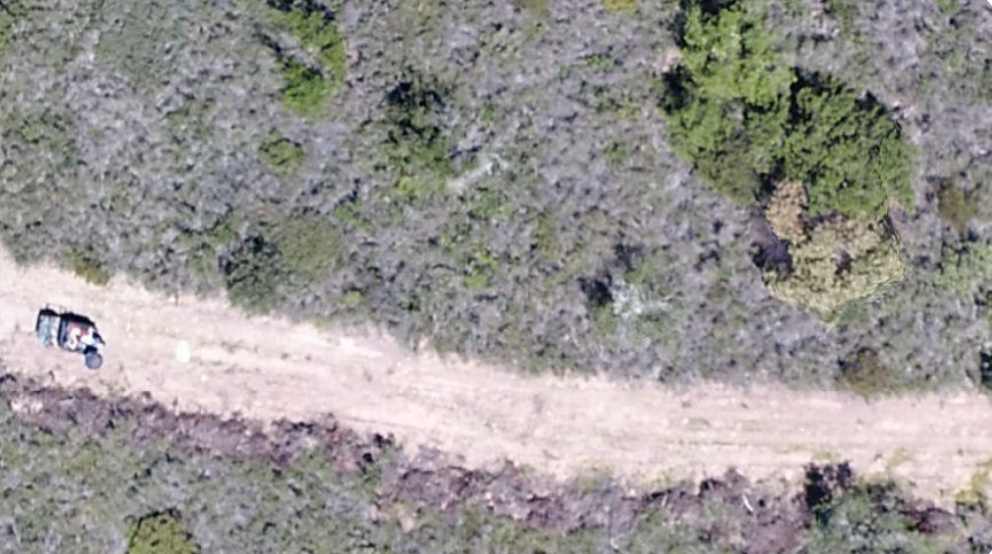
Not bad, but with some swirlyness, note the truck. And moving towards the failure area.
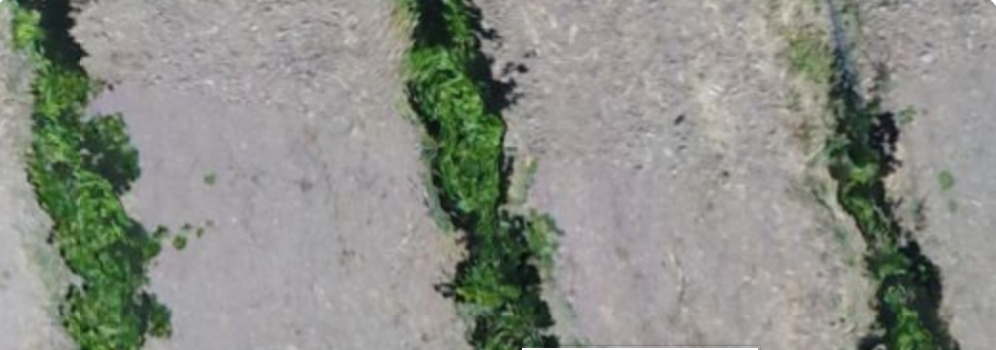
and closer still
extreme swirlyness, then total failure, wahhhhh!
So what to do?
In my online research I found these 2 diagrams that provided a lot of insight
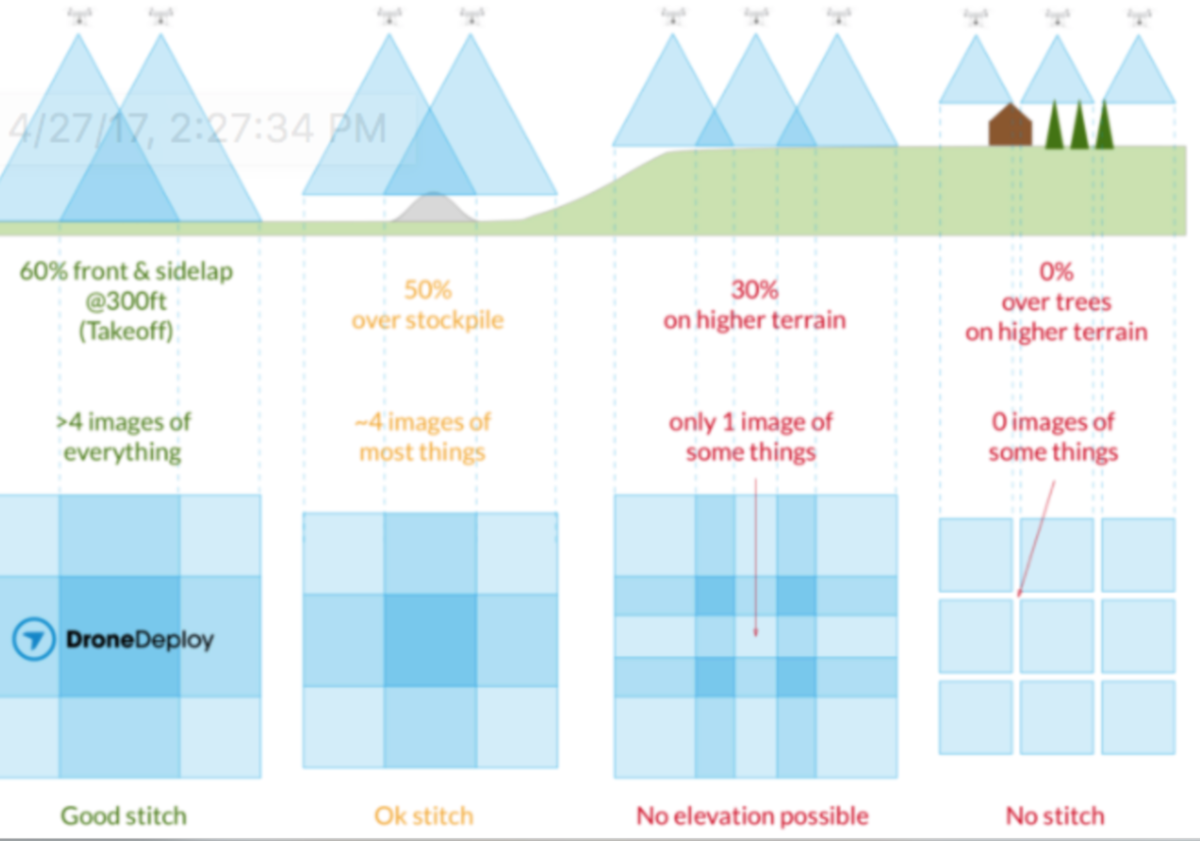
courtesy of Drone Deploy, and this
From MapMadeEasy
These 2 diagrams explain a lot about how to get good stitching, which boil down to;
- Stitching success is very very dependent on altitude
- Overlap is reduced in areas above/higher than the launch point,
- Number of images of an area should be 6 and higher, 10 or higher is great. This is the whole reason for overlap3) Number of images of an area should be 6 and higher, 10 or higher is great. This is the whole reason for overlap
But the vineyard stitch fail didn’t have elevation issues, so that was not the problem here. So I counted the instances of the truck, and it was only 4. So that indicates a lack of overlap.
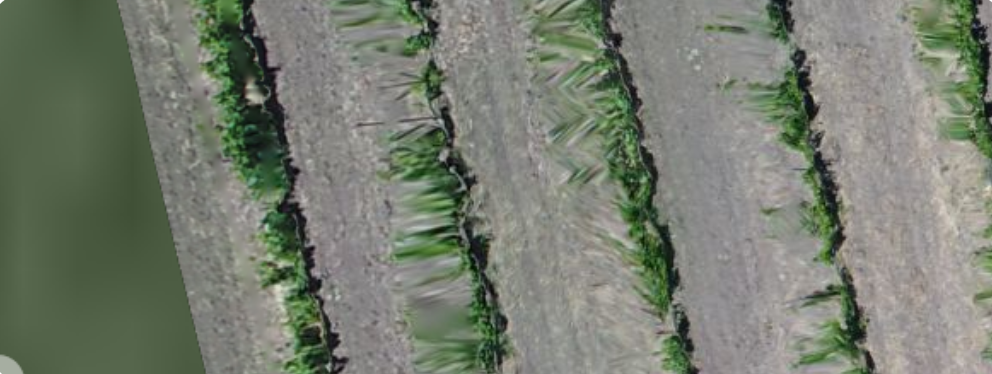
Now what about the area by the fail? Here’s a snap from an actual image of that area
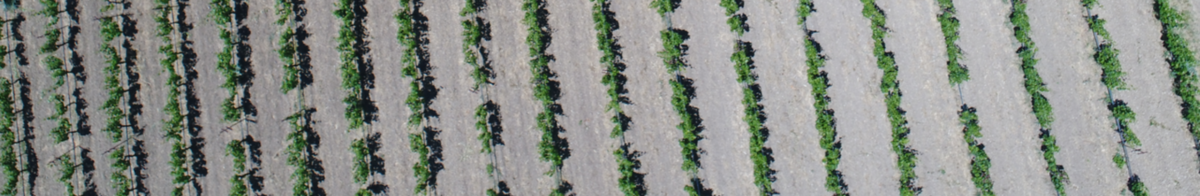
It’s not obvious at first, but if you look at the vines along the edgesof the image, you’ll see that they are imaged obliquely (i.e. as if from the side). And the images towards the center are imaged straight down. This is because off the camera’s FOV and also because we’re quite close to the ground. This I believe is the root cause of the stitch failure.
Let me explain;
Category - Mapping
Posted - 05/16/2017 12:12pm Eight Ways to Use Drone Mapping on the Farm This Season
With the growing season fast approaching, this is a list of some of the most popular ways growers are using drones to improve their processes and make informed decisions about their crops.
Estimate Yield, Measure Lengths and Areas for Planning Tasks
Crop Scout to Detect Parasites and Fungi
Compile Plant Counts
Analyze Stand Establishment
Generate Variable Rate Prescriptions for Nitrogen and Pesticides
Assess and Clean-up Damage After a Storm
Negotiate Fair Crop Loss Percentages
Assess Slope and Drainage After the Harvest
Read the whole article here
Category - Photogrammetry,Mapping
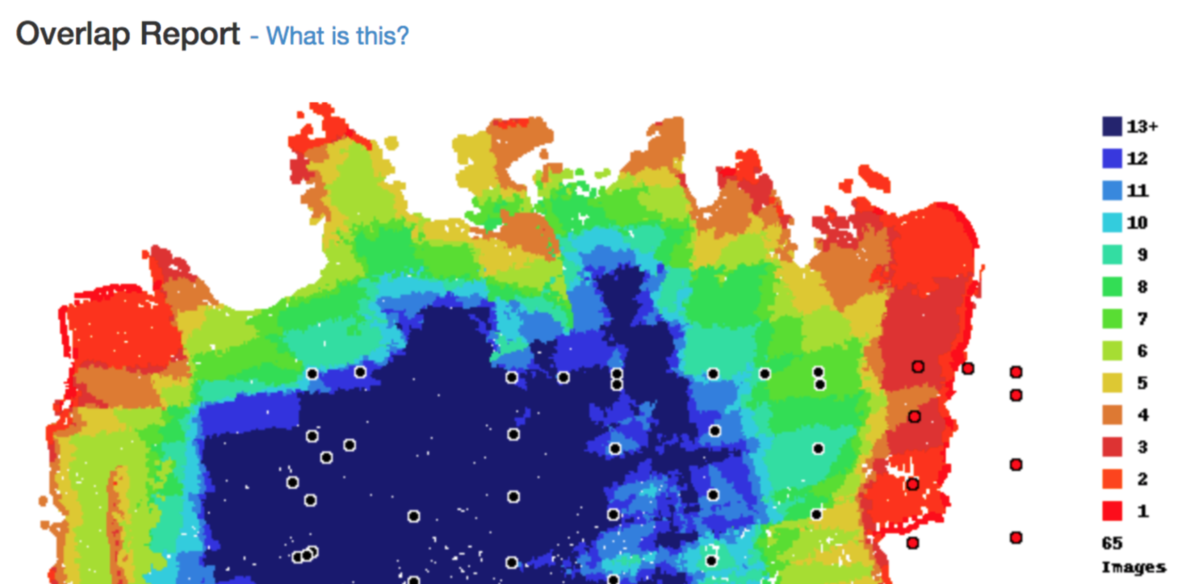
Posted - 05/10/2017 08:14pm Overlap Reports
An Overlap Report is in image that shows the user how many images contain a view of any location within the processed survey area. Generally, the more "looks" at an object the system has to work with, the better the outputs will be (within reason). The Overlap Report color codes these numbers to let users know when the system considers to be good or bad overlap coverage and helps them visualize the things that affect the collection of consistent overlap.
1, 2, 3, 4 or 5 views (reds) of an area is considered to be totally inadequate for the purposes of reconstructing a 3D scene. 6, 7 or 8 views (greens) is considered adequate for the reconstruction of fairly simple objects like fields, basic structures or stockpiles. For the greatest ability to reconstruct a complex scene, getting 9 or more views (blues) is required to have the detail necessary to reconstruct complex objects like buildings, trees or other vegetation.
Good Overlap
This is an example of good, consistent overlap that was collected using the Map Pilot app. There will usually be some red areas around the edges that may not turn out perfectly but everything in the interior of the survey area will turn out very well as it is shaded mostly green and blue.
for the full article, go to;https://support.dronesmadeeasy.com/hc/en-us/articles/207148006-Overlap-Reports

- All
- Agriculture
- Altitude
- California
- Commercial
- Construction
- Crop Science
- Drone Guns
- FAA
- GCP
- General
- Ground Control Points
- Industrial
- Instruction
- Insurance
- Legal
- Light
- Mapping
- NDVI
- Photogrammetry
- Photography
- Public Concern
- Regulations
- Reviews
- Safety
- Security
- State PArks
- Stitching
- Terrain Mapping
- Vineyards
- Volume Measurement
- Webinars
- Wildfires
- Wine Country