
Category - Photogrammetry,Mapping
Posted - 05/10/2017 08:14pm Overlap Reports
An Overlap Report is in image that shows the user how many images contain a view of any location within the processed survey area. Generally, the more "looks" at an object the system has to work with, the better the outputs will be (within reason). The Overlap Report color codes these numbers to let users know when the system considers to be good or bad overlap coverage and helps them visualize the things that affect the collection of consistent overlap.
1, 2, 3, 4 or 5 views (reds) of an area is considered to be totally inadequate for the purposes of reconstructing a 3D scene. 6, 7 or 8 views (greens) is considered adequate for the reconstruction of fairly simple objects like fields, basic structures or stockpiles. For the greatest ability to reconstruct a complex scene, getting 9 or more views (blues) is required to have the detail necessary to reconstruct complex objects like buildings, trees or other vegetation.
Good Overlap
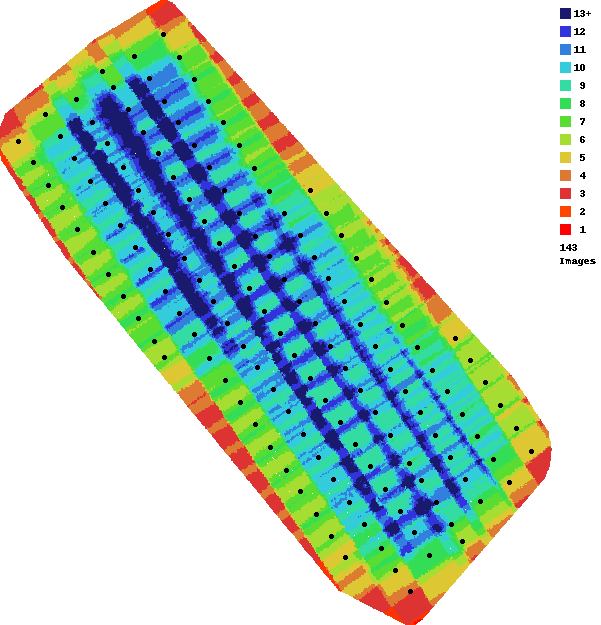
This is an example of good, consistent overlap that was collected using the Map Pilot app. There will usually be some red areas around the edges that may not turn out perfectly but everything in the interior of the survey area will turn out very well as it is shaded mostly green and blue.
for the full article, go to;https://support.dronesmadeeasy.com/hc/en-us/articles/207148006-Overlap-Reports

- All
- Agriculture
- Altitude
- California
- Commercial
- Construction
- Crop Science
- Drone Guns
- FAA
- GCP
- General
- Ground Control Points
- Industrial
- Instruction
- Insurance
- Legal
- Light
- Mapping
- NDVI
- Photogrammetry
- Photography
- Public Concern
- Regulations
- Reviews
- Safety
- Security
- State PArks
- Stitching
- Terrain Mapping
- Vineyards
- Volume Measurement
- Webinars
- Wildfires
- Wine Country
- May 2017